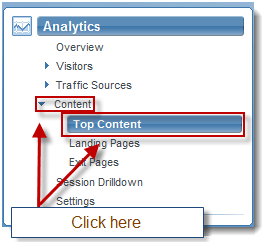
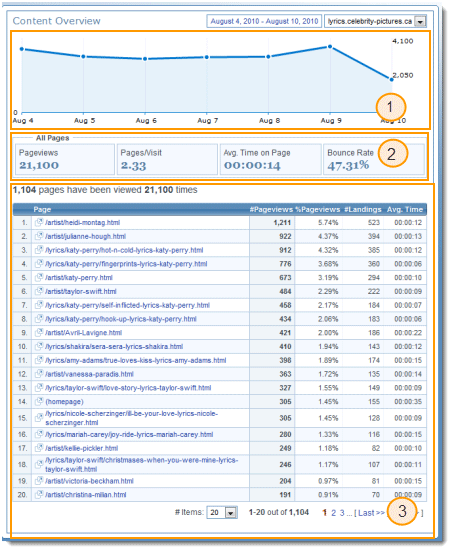
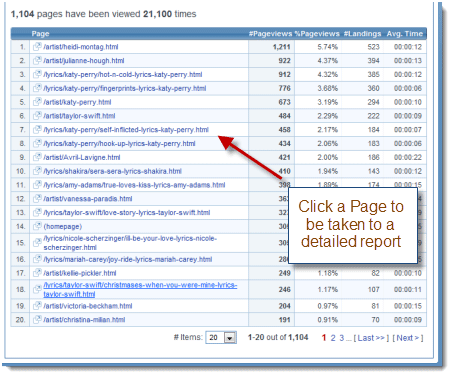
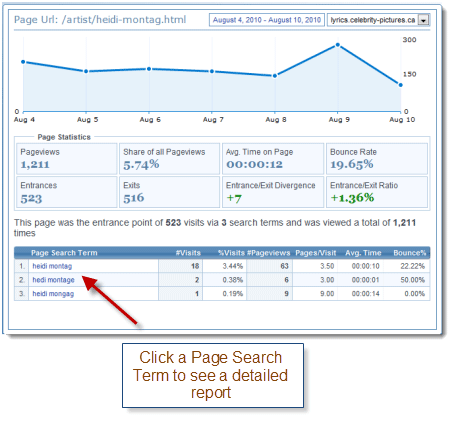
| |  | | Top ContentThe Expo-MAX Real Analytics Top Content report serves as the overview of your Content report as well as a ranking of the pages on your website which receive the highest traffic. The Top Content Report lets you begin with a general overview of how your content is performing and then zero in on more detailed traffic analytics for each page. This valuable data helps you gauge the effectiveness of your off-site marketing efforts as well as your reader retention levels (bounce rate) for each page. To view your Content report, click Content and choose Top Content from the expanded menu on the navigation area on the left-hand side.  The Content Overview appears on the right. There are three components to the Content Overview: (1) the trending graph (2) the site summary and (3) the top content ranking. The Content Overview appears on the right. There are three components to the Content Overview: (1) the trending graph (2) the site summary and (3) the top content ranking. 1. Trending GraphThe Trending Graph shows you the pageviews for all pages for the selected date range. Mouse-over a node for more detailed information for that particular date or time. 1. Trending GraphThe Trending Graph shows you the pageviews for all pages for the selected date range. Mouse-over a node for more detailed information for that particular date or time.  2. Site SummaryThe site summary gives you additional information regarding all of the pages on your website. You can see the total number of pageviews, pages per visit, average time on page and bounce rate for all of the pages on your website, collectively. 2. Site SummaryThe site summary gives you additional information regarding all of the pages on your website. You can see the total number of pageviews, pages per visit, average time on page and bounce rate for all of the pages on your website, collectively.  3. Top Content RankingThe Top Content Ranking breaks down the data for each individual page, showing you the pageviews, percentage of pageviews, number of landings (i.e. how many times users accessed your website by first visiting that page) and average time on page. For even more detailed information, you can click on the Page from the list. This will take you to a report specific to that page. 3. Top Content RankingThe Top Content Ranking breaks down the data for each individual page, showing you the pageviews, percentage of pageviews, number of landings (i.e. how many times users accessed your website by first visiting that page) and average time on page. For even more detailed information, you can click on the Page from the list. This will take you to a report specific to that page. The page-specific Content report appears on another screen. In this screen shot, we’ve clicked on /artist/Heidi-Montag.html (the top ranking page), which opens the detailed report. The Page URL is displayed in the top-left, followed by the trending graph and the page statistics. You can see the total number of page views, average time on page, bounce rate, and share of pageviews (information which is all available on the Top Content report). Additionally, you can see the total number of entrances and exits plus the entrance/exit divergence (number of entrances less number of exits) and entrance/exit ratio (number of entrances divided by number of exits). Lastly, you’ll see a breakdown of the search terms used to reach that particular page, along with the corresponding data. If you click on a Page Search Term, you’ll be taken to the Search Terms report within the Traffic Sources report. The page-specific Content report appears on another screen. In this screen shot, we’ve clicked on /artist/Heidi-Montag.html (the top ranking page), which opens the detailed report. The Page URL is displayed in the top-left, followed by the trending graph and the page statistics. You can see the total number of page views, average time on page, bounce rate, and share of pageviews (information which is all available on the Top Content report). Additionally, you can see the total number of entrances and exits plus the entrance/exit divergence (number of entrances less number of exits) and entrance/exit ratio (number of entrances divided by number of exits). Lastly, you’ll see a breakdown of the search terms used to reach that particular page, along with the corresponding data. If you click on a Page Search Term, you’ll be taken to the Search Terms report within the Traffic Sources report.  SummaryThe Top Content report gives you a broad overview of your highest trafficked pages. You can click through to see specific information about each page URL as well as a breakdown of the search terms that brought visits to that page. This data is a key part of analyzing the performance of each page. SummaryThe Top Content report gives you a broad overview of your highest trafficked pages. You can click through to see specific information about each page URL as well as a breakdown of the search terms that brought visits to that page. This data is a key part of analyzing the performance of each page. | |  | Top Content |
| |
 | Sign Up Now |  |
| |

expo-Max™ Home |
Advertiser Solutions |
Publisher Solutions |
Website Traffic Statistics |
Zip Code Atlas |
Listing.ca
News |
Documentation |
Frequently Asked Questions |
Screenshots |
expo-MAX on Twitter |
Terms of Service |
Privacy Policy |
Refund Policy |
Contact
Copyright © 2024 expo-Max Inc.
All rights reserved.
expo-Max and its derivatives are a property of expo-Max Inc. and may not be used
without writtent permission
or consent of expo-Max Inc.
| This site is PCI compliant with: |
This site supports the following browsers: |
 |
 |
 |
 |
 |
 |
 |
|
Firefox |
Safari |
Chrome |
Explorer |
Opera |
|


 The Content Overview appears on the right. There are three components to the Content Overview: (1) the trending graph (2) the site summary and (3) the top content ranking.
 1. Trending GraphThe Trending Graph shows you the pageviews for all pages for the selected date range. Mouse-over a node for more detailed information for that particular date or time.
  2. Site SummaryThe site summary gives you additional information regarding all of the pages on your website. You can see the total number of pageviews, pages per visit, average time on page and bounce rate for all of the pages on your website, collectively.
  3. Top Content RankingThe Top Content Ranking breaks down the data for each individual page, showing you the pageviews, percentage of pageviews, number of landings (i.e. how many times users accessed your website by first visiting that page) and average time on page. For even more detailed information, you can click on the Page from the list. This will take you to a report specific to that page.
 The page-specific Content report appears on another screen. In this screen shot, we’ve clicked on /artist/Heidi-Montag.html (the top ranking page), which opens the detailed report. The Page URL is displayed in the top-left, followed by the trending graph and the page statistics. You can see the total number of page views, average time on page, bounce rate, and share of pageviews (information which is all available on the Top Content report). Additionally, you can see the total number of entrances and exits plus the entrance/exit divergence (number of entrances less number of exits) and entrance/exit ratio (number of entrances divided by number of exits). Lastly, you’ll see a breakdown of the search terms used to reach that particular page, along with the corresponding data. If you click on a Page Search Term, you’ll be taken to the Search Terms report within the Traffic Sources report.
  SummaryThe Top Content report gives you a broad overview of your highest trafficked pages. You can click through to see specific information about each page URL as well as a breakdown of the search terms that brought visits to that page. This data is a key part of analyzing the performance of each page.


